plot_samplingAD
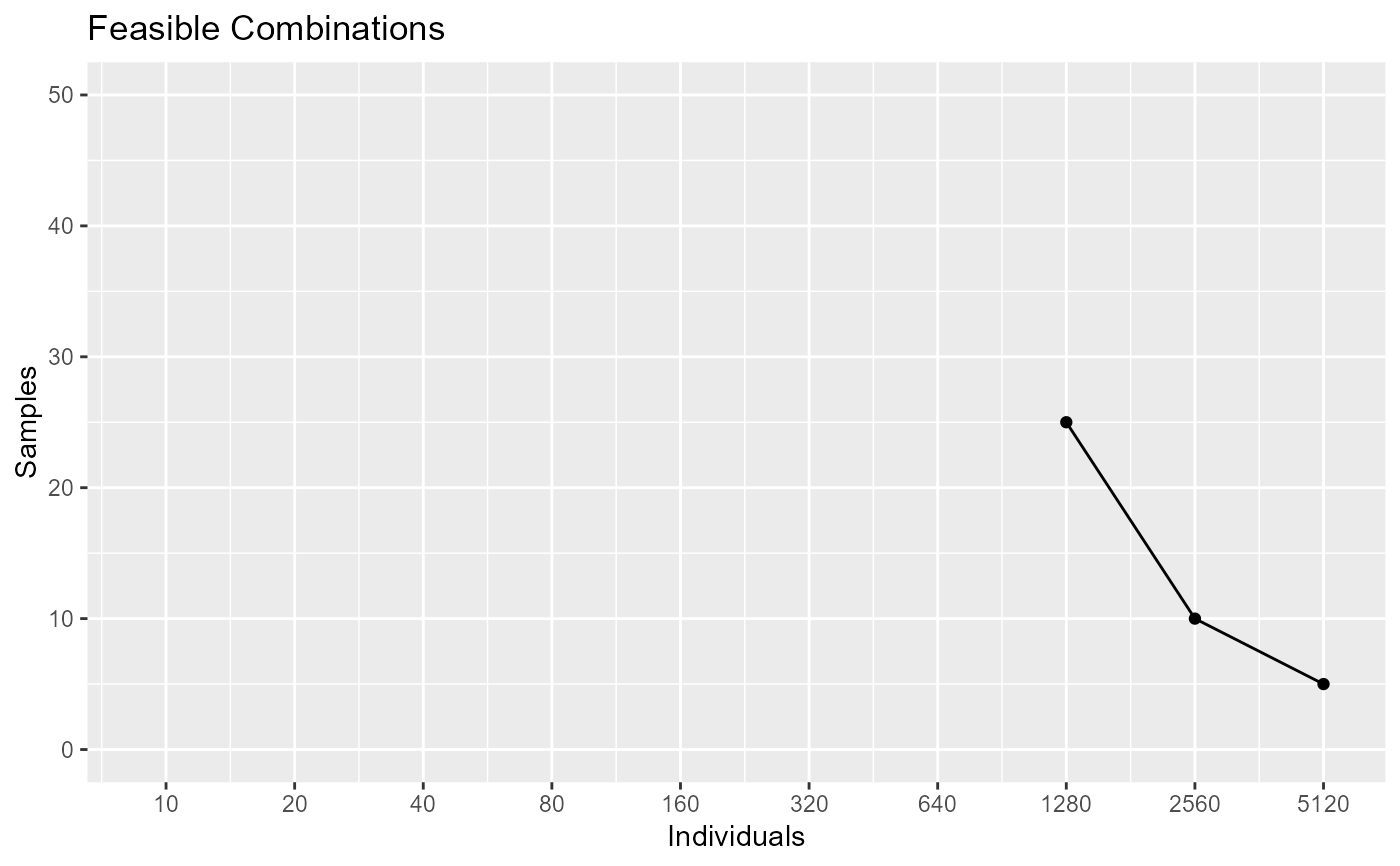
plot_samplingAD.RdPlots the set of feasible combinations of individuals and observations per individual needed to obtain a statistical power given an effect size, alpha level and metric of interest. Based on Pirla, Taquet and Quoidbach (2021).
plot_samplingAD(power = 0.8, metric, r, p.value = 0.05)Arguments
- power
Minimum required power. Input as a number from 0.01 to 0.99. Defaults to 0.8 (80% power).
- metric
Metric of interest. Must be a single character from "Average", "Rel.SD", "SD", "RMSSD", "TKEO", "PAC" or "Autocorrelation".
- r
Number from 0.01 to 0.99 indicating the expected effect size (Pearson correlation) of interest.
- p.value
Alpha level. Must be one of the following numbers: 0.01, 0.05, 0.001, 0.005, 0.001. Defaults to 0.05.
References
Pirla, Taquet and Quoidbach (2021). ADD REFERENCE
Examples
plot_samplingAD(power=0.8, metric="SD", r=0.1, p.value=0.01)